
We compare your assortment matrix against competitors using real shelf data: overlaps and unique items, gaps across categories and price segments, assortment depth and width. Matrix decisions built on data, not gut feel.
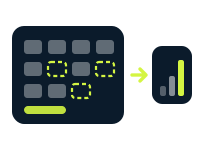
Assortment is category management's biggest lever: analysis shows where yours is underpowered.
See matrix gaps: which segments, brands, and price points competitors carry that you don't.
Compare category width and depth against competitors and prioritize shelf development.
Understand your category's presence across channels: where your segments are underrepresented.
Assess how niche players position themselves through the structure of their assortment.
Three formats to fit the task: a one-time export, recurring data delivery, or a custom solution. Pricing is based on your sources, volume, and frequency: you get a quote before we start.
Capture the data once: for research, migration, or analysis.
Data refreshes on a schedule you set (weekly, daily, or hourly) and is delivered automatically.
Turnkey data-as-a-service: API access, DaaS, or a ready-made interface, dozens of sources, and an SLA.
The final price depends on clear factors. We send a quote and a data sample before work starts.
Describe your task and volume — we'll get back to you with a cost estimate, timeline, and a data sample within one business day.
We collect competitors' live assortment from their websites and platforms, match it against your matrix, and break it down by structure: categories, brands, price segments, key attributes. The result is a precise picture: what only you sell, what everyone carries, and what competitors sell that you don't.
Gaps are quantified: not “they have more products” but “in the $5–$8 band of category X, a competitor carries 120 SKUs against your 30, and the gap has widened for two quarters straight.”
The category team gets a list of concrete listing candidates: segments and brands where competitors are earning and you are absent. And the reverse: overloaded zones where your matrix runs deeper than the market needs.
A recurring snapshot shows the dynamics: where competitors are steering their matrix, which segments they are building up, and which they are exiting. A shift in a competitor's matrix is the most honest signal of what actually sells for them.
A report with conclusions and visualizations, plus the full data for your own analytics: overlap, gap, and segmentation tables. Recurring snapshots feed a dashboard or BI.
Before we start, we'll show a sample report for a similar category: you see the depth of the analysis before paying.
Brief case studies: the data we collected and the results clients achieved.
Drop lists from dozens of marketplaces merged into one stream with metrics, age and domain history.
A full registry of .co.uk blogs and news sites plus a ready-to-use HTML corpus in S3 storage.
Drug prices and availability from pharmacy sources consolidated into one comparable market picture.
An industry-wide database of online stores with verified contacts for the sales team.
We have been collecting price, product, and market data since 2015: and we know monitoring is only valuable when data arrives reliably and in the right shape.
The analysis is built on competitors' actual assortment, not on surveys and estimates.
Overlaps are computed through product matching: matrix comparison without double counting.
Every gap comes with the segment size, price range, and a list of competitors' SKUs.
A ready-to-use report for decisions, plus full tables for your own analytics.
A transparent process: a quote and a data sample before work starts. No hidden fees, no surprises.
Name the category and competitors, and share your matrix.
A sample report and the exact cost: before work starts.
We collect competitors' shelves, match them against your matrix, and segment.
A report with conclusions, data tables, and recurring snapshots with a subscription.
A complete picture of the niche assortment — and concrete listing candidates.
What everyone carries, what is unique to you, and what only competitors sell.
Segments and price points where competitors are present and you are not — with volumes.
Matrix, segmentation, and overlap tables — for your own analytics.
How competitors shift their assortment quarter by quarter — segment trends.
Price and assortment monitoring is part of a larger data collection system. We'll assemble the right service for your task.
Can't find the answer you need? Send a request — we reply within one business day.
For a “you versus the market” comparison — yes, in any convenient format. It also works without one: a niche analysis can be built on competitor data alone.
Through product matching: identical items are linked by barcodes, part numbers, and attributes, with manual verification — no double counting and no false overlaps.
Matrix structure by category, brand, and price segment; overlaps and unique items; quantified gaps; conclusions and recommendations. Plus all the data in tables.
Yes, monthly or quarterly snapshots show matrix dynamics — where your competitors are heading.
Pricing starts at $150. The final cost depends on the number of sources, the data volume, the update frequency, the complexity of site protection, and extra processing. We send an exact quote and a data sample before work starts.